Monday, November 26, 2018

Microphone Self-Noise (Tympan Rev-D2)

As mentioned in a previous post, it is important for hearing aids that the microphones and electronics have a low self-noise.  Because of the amplification in a hearing aid, what might start as an innocuous amount of noise gets multiplied into a very annoying and fatiguing listening experience.  So, for our next revision of Tympan (Tympan Rev-D2), we're looking to further reduce the self-noise of the system.  We are considering an on-board microphone that should offer 5dB less self-noise than the existing design (Tympan Rev-C).  Instead of taking their word for it, let's place the Tympan mics in a super quiet room and see what happens.


Backstory:  The current release of Tympan is "Rev-C".  It is a fine system, though a bit bulky.  Rev-C is bulky because it is composed of two separate boards: the Teensy 3.6 and the Tympan audio board.  To reduce the bulk, we've smashed them together into one board.  This is our new "Rev-D".  The first version (Rev-D1) is otherwise identical to Rev C -- it has the same on-PCB microphones and the same audio interface.  It appears to have the same performance as Rev-C, which is what we expected.  With that success, we're now trying to further improve the system by focusing on its self-noise.  That's Rev-D2.  For Rev-D2, we're using quieter on-PCB microphones and we've added an additional (hopefully even quieter) pre-amplifier for the mics.  We'll see!

Goal:  Today's goal is to compare the self-noise of the new Rev-D2 to the existing Rev-C/Rev-D1.  We expect to see that D2 is quieter, primarily due to its quieter on-PCB microphones.  From the datasheet specs (below), the proposed mic should offer a significant reduction in self-noise (-5dB) (measured at 1kHz), compared to the existing mic.  While comparing Rev-D2 to Rev-C/Rev-D1, we'll also compare to a laboratory grade reference microphone from B&K.

Design Microphone Mic Sensitivity
dBV/Pa
Self-Noise
(dBA)
Existing Mic
(Rev-C/Rev-D1)
Knowles 
SPH1642HT5H-1
-38 @ 1kHz 29
Proposed Mic
(Rev-D2)
Knowles 
SPM0687LR5H-1
-32 @ 1kHz 24
Reference Mic B&K 4191 -38 @ 250Hz 20


Setup

Approach: The first step is calibrating each Tympan's microphone so that we know how to interpret the recorded audio.  By calibrating each Tympan's microphone, we can express the apparent self-noise levels in terms of apparent sound pressure level (SPL), which is a good way of doing an apples-to-apples comparison across systems.  After we've calibrated the Tympan systems, we'll put the Tympan's into a quiet sound room to (hopefully) measure their self-noise.  Ideally, the ambient noise in the sound room will be low enough to discern the self-noise of the on-board microphones.

Hardware:  We used a Tympan Rev-D1 and a Rev-D2.  We also recorded the ambient sound levels using our laboratory-grade reference microphone, a B&K 4191 along with a National Instruments data acquisition system.   

Gain Settings: In addition to the new microphone on Rev-D2, the Rev-D2 also features a new preamp between the microphone and the Tympan's audio interface chip (a TI AIC3206).  The pre-amp provides about 15 dB of additional gain via an amplifier that we believe to be quieter than the programmable gain in the AIC3206.  Therefore, for the testing with the Rev-D2, we turned down the gain on the AIC3206 by 15 dB, which should make the overall gain between the Rev-D1 and Rev-D2 about the same.  

Physical Setup: The sound recordings were made in a single-walled, acoustic test chamber, which is fairly quiet above  125 Hz.  As shown in the figure at the top of this post, the lab-grade B&K microphone was positioned 1" above the Tympan's on-board PCB mic so that it is placed along the same axis as the mic under test.  

Tympan Setup.  The Tympans were configured to record from their on-PCB microphones.  They were configured to use a sample rate of 44.1 kHz and to write their raw audio data straight to the Tympan's SD card.  The Tympan Arduino code is here on GitHub.  The Tympans were running on their battery power.


Calibration

To calibrate the microphones across a wide frequency spectrum (125Hz-22kHz), white noise was created in an audio effects editor and played through 4 speakers in the sound room.  The speakers were pointed in different directions to create a diffuse, rather than directional, sound field.


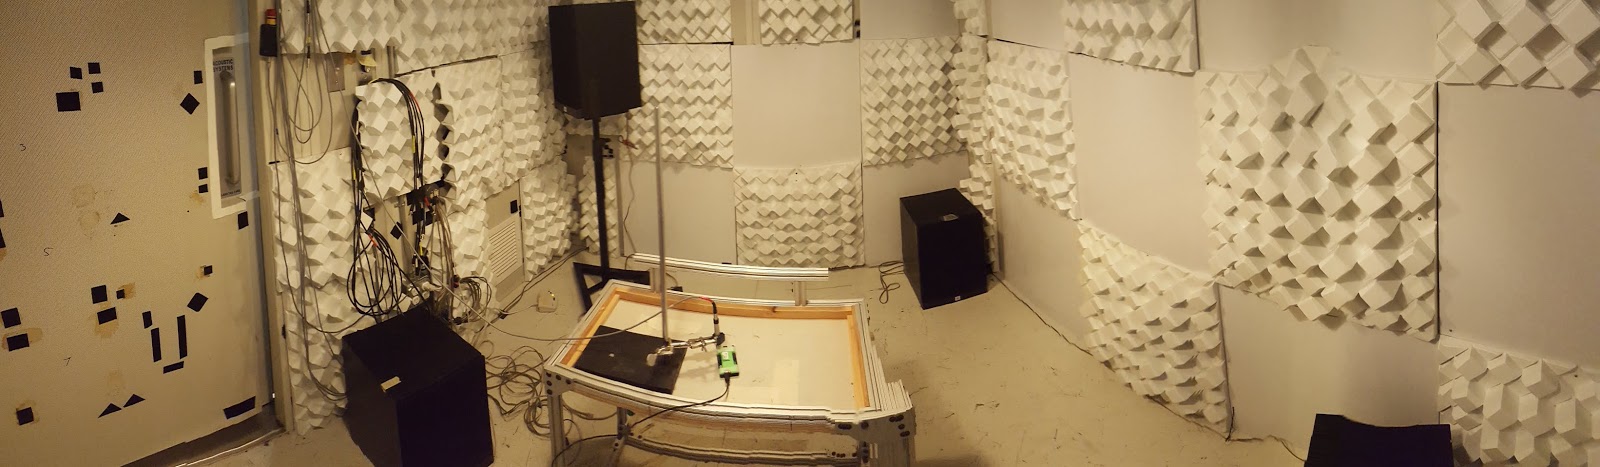
To define the Tympan's frequency response from 125Hz to 16kHz, the Tympan output was filtered by octave-bands, then the RMS value was taken and converted to a dB log scale that references the Tympan's Full Scale Output (+1.0).


Sensitivity for a digital microphone is often reported as the output at 94dB SPL (i.e. 1 Pa), compared to its full-scale output:

This sensitivity can be rephrased in terms of the dB log scale:

The figure below shows the raw microphone response and the derived sensitivity.  At 1kHz, the proposed microphone (D2) is less sensitivity (-1.8dB) than the existing microphone (D1), which is expected.


Self-Noise

Now that the microphones are calibrated, we can take a recording of a quiet sound room with the mics under test and relate that to an equivalent sound pressure level.  The same analysis was applied as before: the recording was filtered into octave bands then the RMS value was taken for each band.

From the figure below, the proposed mic shows a 1.5dB reduction in self-noise at 1kHz, compared to the existing mic.   We can also report the A-weighted average by applying a correction to the RMS value for each octave band (as described here).  That shows a 1.7dB reduction in A-weighed self-noise.


Conclusion

The self-noise of the proposed microphone offers a small improvement in self-noise (2dB) which is less than that expected from the datasheets (5dB).  As a follow-up, it will be interesting to see if this is due to the thermal noise of the microphone, or self-noise in the front-end electronics.

Wednesday, August 22, 2018

Microphone Self-Noise

A hearing assistive device must not be noisy.  At minimum, noise will be annoying.  At worst, noise will harm, not help a person's ability to hear.  So, for our Tympan device, I want to make sure that it has low self-noise.  In this post, I show how the microphone that you choose can strongly affect the apparent noise of your system.  Spoiler: be careful with lapel mics because they can be very noisy!


Goal:  I want to measure the self-noise of different microphones in combination with the Tympan.

Approach:  My approach is to first calibrate the Tympan when using each microphone.  That way, when comparing between microphones, I'm comparing apples-to-apples.  Once calibrated, I will put the devices in a super-quiet environment and make ambient sound recordings.  The super-quiet environment will probably be so quiet that recordings will reveal the self-noise of the microphones.

Hardware:  As shown in the picture above, I am testing with a Tympan Rev C, which includes built-in microphones (Knowles SPH1642) on its PCB.  I also made recordings with a Sony lapel microphone (ECM-CS10) plugged into the Tympan's microphone jack.  As a reference microphone for the calibration, I used a B&K 2250 sound level meter (SLM) with its 4191 microphone element.

Setup:  I performed the recordings in our single-walled acoustic test chamber in the basement of our building.  It is fairly quiet, though it is not as quiet at the lowest frequencies (125 Hz and below).  As shown in the figure at the top of this post, I put the lapel microphone and the B&K microphone very close to the Tympan's built-in PCB mic.

Device Configuration:  The Tympan was configured to record audio straight to its SD card as 32-bit floating point samples, switching automatically between the two microphones after a fixed interval of time.  It was configured with an input gain of +15dB for all recordings.  My code is on GitHub here.  The B&K SLM was configured to record its calibrated audio to its compact flash card.

Calibration:  To calibrate the microphones, I played white noise into the sound chamber.  The B&K SLM recorded the audio in calibrated units, as shown in the first plot below.  Simultaneously, the Tympan recorded the audio (through each of the two microphones) in uncalibrated units, as shown in the second plot below.  By comparing the raw Tympan levels with the calibrated B&K levels, the bottom plot shows the sensitivity of the Tympan+microphone at each frequency.


Measuring Self-Noise:  Turning off the white noise stimulation, the sound chamber was very quiet. Again, the B&K SLM and the Tympan made recordings from their microphones.  My assumption is that, especially for the Tympan, the true background noise in the sound chamber was so low that the recordings will reveal the self-noise of the microphones.

Self-Noise Expressed as SPL:  The first plot below shows the raw, uncalibrated noise levels recorded by the Tympan.  To convert these values to SPL, I need to apply the calibration data discussed above.  There's a couple ways that I could apply the calibration.  The middle plot shows the estimated SPL if I were to have calibrated the Tympan only at a 1 kHz, which is a common, simple way to calibrate a device.  Alternatively, if we use the full frequency-dependent calibration for the Tympan, the bottom plot shows the estimated SPL.  Using either calibration approach, the conclusion is the same: the Sony lapel mic has much higher self-noise than the built-in PCB mics!

The Microphone Matters!  Getting quantitative, I can summarize these spectra by applying an A-weighting curve and computing the broadband sound pressure level (ie, "dBA").  From these recordings, the Tympan + Lapel Mic has a self noise equivalent to an ambient noise level of 41-43 dBA (depending upon the calibration approach).  By contrast, the Tympan + PCB Mics show a noise level of between 27-29 dBA.  This 14 dB difference is a big!

Conclusion:  Since low self-noise is good, the Tympan's built-in PCB microphones seem to be a better choice than this Sony lapel microphone.  I look forward to trying other microphones to see if I can get even lower self-noise.

Follow-Up: What Self-Noise Should Be Expected?  After completing this post, I realized that I should have looked at the microphone datasheets to see what the manufacturers say about each microphone's self-noise.  Here's what I found:

  • For the PCB mics (SPH1642), the self-noise is not reported directly.  But, they report the signal-to-noise ratio as 65 dBA when given a 1 kHz signal at 94 dB SPL.  This means that the noise floor for the mics is (94 dB - 65 dBA) = 29 dBA.  This is exactly the value that I found, when I used the simple calibration for 1 kHz.  This gives me additional confidence in my measurement technique.
  • For the Sony lapel mic (ECM-CS10), the noise level is reported simply as "38 dB".  Presumably, this is A-weighted, but there is no more information provided.  My own value (41 dBA, for single-frequency calibration) is 3 dB higher than the datasheet value.  The cause for the difference is unknown, though the difference is modest.

Friday, January 19, 2018

Measuring Audio Latency

For real-time audio processing, it is often important to minimize the delay between audio coming out of the system compared to the audio coming into the system.  This is especially true of hearing aids, where too much latency can cause the listener to perceive an echo (or have a comb-filtering effect), which end up degrading rather than helping the listener's experience.  Research suggests that the maximum tolerable latency in a hearing aid is only 14-30 msec.  If Tympan wants to be helpful, we need to make sure that we keep our latency shorter than this.  Let's find out what our system does!


Test Setup.  To measure the latency of the Tympan, we need to inject an audio signal into the Tympan and then measure delay of the output audio relative to the input audio.  There's lots of ways that this can be done.  I chose to use the setup shown in the picture above.  In this setup, I generate my test audio signals from my PC.  I use a series of 1 kHz tone bursts that are 1 second long.  The audio comes out of my PC and (as shown in the red line) is split so that it goes to the input of the Tympan *and* to the input of an audio recorder.  The output of the Tympan is then (as shown in the blue line) routed to the other input of the audio recorder.  The stereo audio file produced by the audio recorder will contain the input audio in the left channel and the output audio in the right channel.  It will then be a simple post-processing analysis to measure the delay between the two channels.


Raw Data.  An example recording and an example Matlab processing script are in my GitHub here.  The plot above shows the example data.  As you can see, there are three tone bursts in the recording.  At this timescale, one cannot see any delay between the signals, but that is because we are not zoomed in enough.  The plot below zooms in to the start of one of the tone bursts.  Here, we definitely see that the Tympan output has a slight delay relative to the direct audio signal.


Analysis.  Using the plot above, we could visually assess the latency between the two channels.  But, to do even better, I included a Matlab script in the GitHub directory that computes the cross-correlation between the two channels.  The best estimate of the latency will be when when the cross-correlation is maximum.  For this recording, the best estimate of the latency is 3.1 msec.  That's nice and short!

Measuring other Tympan Configurations.  Expanding from this single measurement, I then repeated the process and measured the latency for a variety of different configurations of the Tympan.  I tried different audio block sizes and I tried different audio processing algorithms.  My results are shown in the figure below.  The simple 3.1 msec value reported above can be seen in the bottom-left of the plot as the first point on the yellow line.  All of the other configurations result in increased latency, but there are still a lot of configurations that are shorter than the 14-30 msec upper limit from the literature.


Components of the Latency.  After working with the system for a while, I've identified three contributors to the latency:

  • Hardware:  The audio interface for the Tympan is a TI 3206 AIC.  This chip has a pipeline that is 17 samples long on the input and 21 samples long for the output.  So, for this round-trip testing, it contributes 38 samples of latency, which at sample rate of 24 kHz is a latency of 1.58 msec.
  • Audio Library:  The Tympan audio library is based on the Teensy audio library, which has employs a queue of two audio blocks in order to prevent audio hiccups and drop-outs.  In the Tympan library, this audio block size is configurable, hence my ability to make the graph above where I vary the block size.  For a block size of 16 samples, the library's latency is 2*16=32 samples, which is 1.33 msec at 24 kHz.  Totaled with the hardware latency (1.58 msec + 1.33 msec), we get 2.9 msec, which is very close to the 3.1 msec value that I measured.  Great!
  • Audio Processing:  Beyond the audio library, most any actual audio processing will also introduce additional latency.  A typical (symmetric) FIR filter, for example, will result in a group delay that is half the length of the FIR filter.  Other filters and other operations (such as FFT) introduce delays as well.  The specific amount of latency may vary, but some latency is inherent in the math.  For the Tympan, we see the latency for FIR and FFT in the graph above.
Optimizing for Minimum Latency.  From this exploration, I've learned that latency can be minimized by (1) using the shortest audio block size that the system can handle and (2) running the simplest audio processing algorithm that you can get away with.  On this latter point, we all want our audio processing to have extremely fine frequency resolution.  But, high resolution requires long FIR filters or long FFTs.  Long FIRs/FFTs introduce a lot of latency, however.  So, if you want low latency, you need to use the shortest FIRs and FFTs that you can.