Showing posts with label Calibration. Show all posts

Monday, November 26, 2018

Microphone Self-Noise (Tympan Rev-D2)

As mentioned in a previous post, it is important for hearing aids that the microphones and electronics have a low self-noise.  Because of the amplification in a hearing aid, what might start as an innocuous amount of noise gets multiplied into a very annoying and fatiguing listening experience.  So, for our next revision of Tympan (Tympan Rev-D2), we're looking to further reduce the self-noise of the system.  We are considering an on-board microphone that should offer 5dB less self-noise than the existing design (Tympan Rev-C).  Instead of taking their word for it, let's place the Tympan mics in a super quiet room and see what happens.


Backstory:  The current release of Tympan is "Rev-C".  It is a fine system, though a bit bulky.  Rev-C is bulky because it is composed of two separate boards: the Teensy 3.6 and the Tympan audio board.  To reduce the bulk, we've smashed them together into one board.  This is our new "Rev-D".  The first version (Rev-D1) is otherwise identical to Rev C -- it has the same on-PCB microphones and the same audio interface.  It appears to have the same performance as Rev-C, which is what we expected.  With that success, we're now trying to further improve the system by focusing on its self-noise.  That's Rev-D2.  For Rev-D2, we're using quieter on-PCB microphones and we've added an additional (hopefully even quieter) pre-amplifier for the mics.  We'll see!

Goal:  Today's goal is to compare the self-noise of the new Rev-D2 to the existing Rev-C/Rev-D1.  We expect to see that D2 is quieter, primarily due to its quieter on-PCB microphones.  From the datasheet specs (below), the proposed mic should offer a significant reduction in self-noise (-5dB) (measured at 1kHz), compared to the existing mic.  While comparing Rev-D2 to Rev-C/Rev-D1, we'll also compare to a laboratory grade reference microphone from B&K.

Design Microphone Mic Sensitivity
dBV/Pa
Self-Noise
(dBA)
Existing Mic
(Rev-C/Rev-D1)
Knowles 
SPH1642HT5H-1
-38 @ 1kHz 29
Proposed Mic
(Rev-D2)
Knowles 
SPM0687LR5H-1
-32 @ 1kHz 24
Reference Mic B&K 4191 -38 @ 250Hz 20


Setup

Approach: The first step is calibrating each Tympan's microphone so that we know how to interpret the recorded audio.  By calibrating each Tympan's microphone, we can express the apparent self-noise levels in terms of apparent sound pressure level (SPL), which is a good way of doing an apples-to-apples comparison across systems.  After we've calibrated the Tympan systems, we'll put the Tympan's into a quiet sound room to (hopefully) measure their self-noise.  Ideally, the ambient noise in the sound room will be low enough to discern the self-noise of the on-board microphones.

Hardware:  We used a Tympan Rev-D1 and a Rev-D2.  We also recorded the ambient sound levels using our laboratory-grade reference microphone, a B&K 4191 along with a National Instruments data acquisition system.   

Gain Settings: In addition to the new microphone on Rev-D2, the Rev-D2 also features a new preamp between the microphone and the Tympan's audio interface chip (a TI AIC3206).  The pre-amp provides about 15 dB of additional gain via an amplifier that we believe to be quieter than the programmable gain in the AIC3206.  Therefore, for the testing with the Rev-D2, we turned down the gain on the AIC3206 by 15 dB, which should make the overall gain between the Rev-D1 and Rev-D2 about the same.  

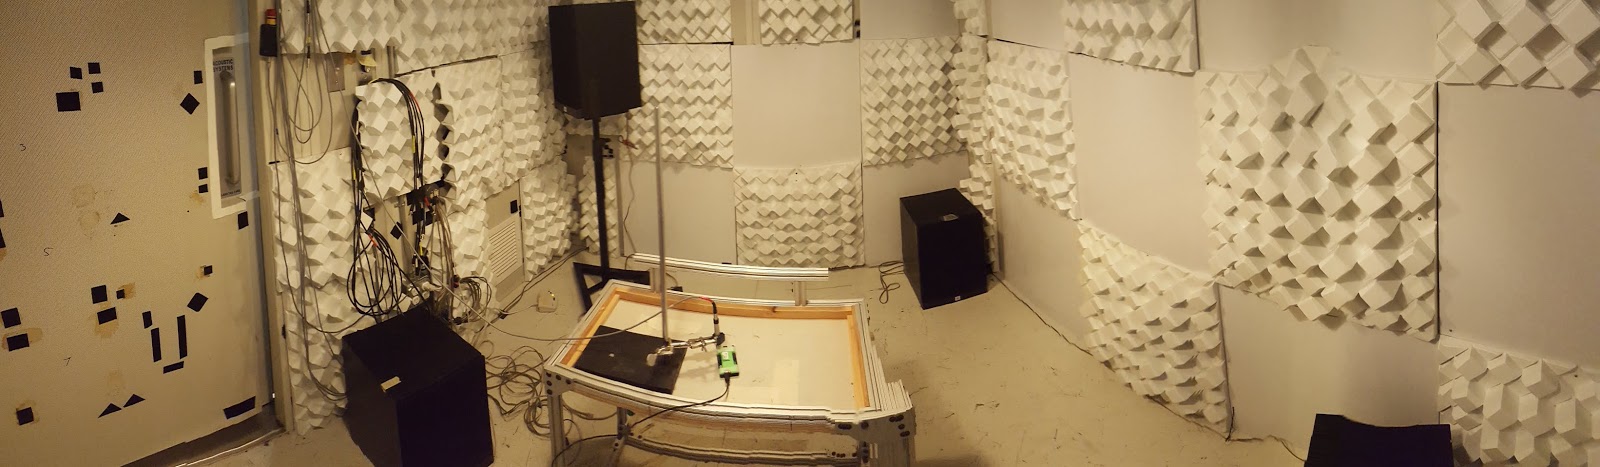
Physical Setup: The sound recordings were made in a single-walled, acoustic test chamber, which is fairly quiet above  125 Hz.  As shown in the figure at the top of this post, the lab-grade B&K microphone was positioned 1" above the Tympan's on-board PCB mic so that it is placed along the same axis as the mic under test.  

Tympan Setup.  The Tympans were configured to record from their on-PCB microphones.  They were configured to use a sample rate of 44.1 kHz and to write their raw audio data straight to the Tympan's SD card.  The Tympan Arduino code is here on GitHub.  The Tympans were running on their battery power.


Calibration

To calibrate the microphones across a wide frequency spectrum (125Hz-22kHz), white noise was created in an audio effects editor and played through 4 speakers in the sound room.  The speakers were pointed in different directions to create a diffuse, rather than directional, sound field.


To define the Tympan's frequency response from 125Hz to 16kHz, the Tympan output was filtered by octave-bands, then the RMS value was taken and converted to a dB log scale that references the Tympan's Full Scale Output (+1.0).


Sensitivity for a digital microphone is often reported as the output at 94dB SPL (i.e. 1 Pa), compared to its full-scale output:

This sensitivity can be rephrased in terms of the dB log scale:

The figure below shows the raw microphone response and the derived sensitivity.  At 1kHz, the proposed microphone (D2) is less sensitivity (-1.8dB) than the existing microphone (D1), which is expected.


Self-Noise

Now that the microphones are calibrated, we can take a recording of a quiet sound room with the mics under test and relate that to an equivalent sound pressure level.  The same analysis was applied as before: the recording was filtered into octave bands then the RMS value was taken for each band.

From the figure below, the proposed mic shows a 1.5dB reduction in self-noise at 1kHz, compared to the existing mic.   We can also report the A-weighted average by applying a correction to the RMS value for each octave band (as described here).  That shows a 1.7dB reduction in A-weighed self-noise.


Conclusion

The self-noise of the proposed microphone offers a small improvement in self-noise (2dB) which is less than that expected from the datasheets (5dB).  As a follow-up, it will be interesting to see if this is due to the thermal noise of the microphone, or self-noise in the front-end electronics.

Wednesday, August 22, 2018

Microphone Self-Noise

A hearing assistive device must not be noisy.  At minimum, noise will be annoying.  At worst, noise will harm, not help a person's ability to hear.  So, for our Tympan device, I want to make sure that it has low self-noise.  In this post, I show how the microphone that you choose can strongly affect the apparent noise of your system.  Spoiler: be careful with lapel mics because they can be very noisy!


Goal:  I want to measure the self-noise of different microphones in combination with the Tympan.

Approach:  My approach is to first calibrate the Tympan when using each microphone.  That way, when comparing between microphones, I'm comparing apples-to-apples.  Once calibrated, I will put the devices in a super-quiet environment and make ambient sound recordings.  The super-quiet environment will probably be so quiet that recordings will reveal the self-noise of the microphones.

Hardware:  As shown in the picture above, I am testing with a Tympan Rev C, which includes built-in microphones (Knowles SPH1642) on its PCB.  I also made recordings with a Sony lapel microphone (ECM-CS10) plugged into the Tympan's microphone jack.  As a reference microphone for the calibration, I used a B&K 2250 sound level meter (SLM) with its 4191 microphone element.

Setup:  I performed the recordings in our single-walled acoustic test chamber in the basement of our building.  It is fairly quiet, though it is not as quiet at the lowest frequencies (125 Hz and below).  As shown in the figure at the top of this post, I put the lapel microphone and the B&K microphone very close to the Tympan's built-in PCB mic.

Device Configuration:  The Tympan was configured to record audio straight to its SD card as 32-bit floating point samples, switching automatically between the two microphones after a fixed interval of time.  It was configured with an input gain of +15dB for all recordings.  My code is on GitHub here.  The B&K SLM was configured to record its calibrated audio to its compact flash card.

Calibration:  To calibrate the microphones, I played white noise into the sound chamber.  The B&K SLM recorded the audio in calibrated units, as shown in the first plot below.  Simultaneously, the Tympan recorded the audio (through each of the two microphones) in uncalibrated units, as shown in the second plot below.  By comparing the raw Tympan levels with the calibrated B&K levels, the bottom plot shows the sensitivity of the Tympan+microphone at each frequency.


Measuring Self-Noise:  Turning off the white noise stimulation, the sound chamber was very quiet. Again, the B&K SLM and the Tympan made recordings from their microphones.  My assumption is that, especially for the Tympan, the true background noise in the sound chamber was so low that the recordings will reveal the self-noise of the microphones.

Self-Noise Expressed as SPL:  The first plot below shows the raw, uncalibrated noise levels recorded by the Tympan.  To convert these values to SPL, I need to apply the calibration data discussed above.  There's a couple ways that I could apply the calibration.  The middle plot shows the estimated SPL if I were to have calibrated the Tympan only at a 1 kHz, which is a common, simple way to calibrate a device.  Alternatively, if we use the full frequency-dependent calibration for the Tympan, the bottom plot shows the estimated SPL.  Using either calibration approach, the conclusion is the same: the Sony lapel mic has much higher self-noise than the built-in PCB mics!

The Microphone Matters!  Getting quantitative, I can summarize these spectra by applying an A-weighting curve and computing the broadband sound pressure level (ie, "dBA").  From these recordings, the Tympan + Lapel Mic has a self noise equivalent to an ambient noise level of 41-43 dBA (depending upon the calibration approach).  By contrast, the Tympan + PCB Mics show a noise level of between 27-29 dBA.  This 14 dB difference is a big!

Conclusion:  Since low self-noise is good, the Tympan's built-in PCB microphones seem to be a better choice than this Sony lapel microphone.  I look forward to trying other microphones to see if I can get even lower self-noise.

Follow-Up: What Self-Noise Should Be Expected?  After completing this post, I realized that I should have looked at the microphone datasheets to see what the manufacturers say about each microphone's self-noise.  Here's what I found:

  • For the PCB mics (SPH1642), the self-noise is not reported directly.  But, they report the signal-to-noise ratio as 65 dBA when given a 1 kHz signal at 94 dB SPL.  This means that the noise floor for the mics is (94 dB - 65 dBA) = 29 dBA.  This is exactly the value that I found, when I used the simple calibration for 1 kHz.  This gives me additional confidence in my measurement technique.
  • For the Sony lapel mic (ECM-CS10), the noise level is reported simply as "38 dB".  Presumably, this is A-weighted, but there is no more information provided.  My own value (41 dBA, for single-frequency calibration) is 3 dB higher than the datasheet value.  The cause for the difference is unknown, though the difference is modest.

Friday, May 26, 2017

Calibrating My Earphones with the Tympan

At its core, a hearing aid is a microphone, an amplifier, and an earphone.  Each element is critical to the quality of the sound produced by the device.  For the Tympan, it (currently) is simply the amplifier (ie, the electronics) -- you have to bring your own microphones and speakers.  In my last post, I looked at a few different microphones.  Today, I'm going to look at some earphones.  I'm going to calibrate a set of earphones with the Tympan to measure the frequency response and overall loudness.
Earphones:  The earphones that I'm going to calibrate are my Klipsch S4 earbuds.  They are absolutely nothing special.  They are simply low-cost, consumer-level earbuds like anyone might have.  I think that inexpensive earbuds are where a lot of people will start when using the Tympan, so it's where I'm going to start with my earphone calibration.

Setup:  My overall setup is shown in the figure above.  I'm using the the Tympan electronics to drive the earbuds.  The Tympan has been programmed to generate a tone that sweeps from low frequency to high frequency .  The earbuds are fixed in a coupler, which mates to a laboratory-grade microphone (B&K 4192) and data acquisition system.  So, by generating tones at known digital level in the Tympan, I can measure the corresponding sound pressure level produced by the earbuds in the 2cc coupler.
Using the B&K 4949 2cc Coupler
Coupler:  The coupler is a very important part of this setup.  Earbuds are supposed to be worn in an ear canal.  There is very little volume in your ear canal that the earbud needs to drive.  So, if you want to measure the response of an earbud, you need to use a coupler that creates a similar small-volume environment.

Which Coupler to Use?  There are two typical choices for couplers for this kind of testing: (1) an ANSI-standard 2cc coupler, or (2) a so-called "artificial ear".  While the artificial ear is designed to give a more realistic response, a basic 2cc coupler is what the ANSI standard uses for hearing aid assessment, so that's what I'm starting with.  My 2cc coupler is a B&K Type 4946, shown above.
Fitting my earbud to the coupler's adapter.  The output of the earbud should be flush with the hole in the adapter plate.

Fitting the Earbud:  The 4949 includes different adapter pieces to help fit a variety of hearing aid styles.  For my earbud, I chose to use the broad dish-shaped adapter piece intended for in-the-ear hearing aids.  As you can see above, I used putty to hold the earbud in place and positioned the earbud such that the output of the earbud is flush with the opening of the adapter.  It isn't pretty, but I think that it gets the job done.

Completing the Setup:  Once the earbud and adapter plate were fit to one end of the coupler, I inserted the measurement microphone into the other end of the coupler.  I connected the earbuds to the Tympan electronics and programmed the electronics to produce frequency sweeps at different digital levels (my code is on my GitHub here).
My setup used to calibrate the Tympan output with my Klipsch consumer-level earbuds.
Raw Data:  Some raw data from this measurement is shown below (raw data is in my GitHub here).  It is the measured sound output from the earpbud as measured by the microphone in the 2cc coupler.  This microphone is calibrated to units of Pascals from which sound pressure level (SPL) is easily computed.  As you can see, I had the Tympan generate five frequency sweeps, each one at a louder amplitude.

Raw data recorded from the Klipsch earbuds during this calibration testing.
Actual Amplitude:  In my Arduino code, I thought that I was commanding the amplitude to step from 0.1 up to 1.0.  In later analysis, however, I discovered that the ToneSweep object from the Teensy Audio library only produces half the amplitude that you think.  So, when you command "1.0", you actually get an amplitude of 0.5.  I confirmed through by sending the audio out the USB Audio connection to the PC.  It was half.  So, instead of spanning 0.1 to 1.0, my test spanned only 0.05 to 0.5.

Low-Level Noise:  When I looked at this raw data in the frequency domain (see spectrogram below), I was surprised to see this strange, low-level background noise appear at the higher drive levels.  It first appears at a digital drive level of 0.25.  What is this?  At lower drive levels it is not there -- it just magically appears at 0.25.  This is very strange.
Spectrogram of audio produced by the Tympan via the Klipsch earbuds during the calibration tests.  When the drive amplitude is 0.25 and above, a low-level background noise appears.
[Follow-Up: Additional testing suggests that this noise might be related to the Tympan's audio codec (TI 3206) struggling to deliver the required current to these low impedance (18 ohm) earbuds.  That's my current working theory, but I cannot yet definitely confirm that that's the issue.  I'll have to do more examination of this in the future.]

Data Analysis:  From this raw data, I divided the recording to isolate each frequency sweep.  Then I measured the SPL at each frequency (analysis code here, more Matlab functions here).  For each drive amplitude, the measured response is shown in the figure below.  As expected, the frequency response is basically independent of amplitude, which is good.
Measured frequency response for different drive levels.
The Bottom Line:  The figure below is how I chose to summarize these results.  The red line is the measured frequency response and loudness when driving at an amplitude of 0.25, which is when that low-level noise/distortion appears.  The blue line is the frequency response that I measured at my strongest drive level (0.5 relative to full scale) that I then scaled up as if I had driven it at the hardware's maximum drive level (1.0 relative to digital full scale).  As can be seen, at 1 kHz, the system should be able to produce about 117 dB SPL at full drive.
Bass Boost:  A secondary result that is obvious in this graph is that these earphones do not have a flat frequency response.  Not at all.  These consumer-level earphones clearly provide a strong boost to the frequencies below, say, 500 Hz.  I'm guessing that this bass boost this was a conscious decision by the designers in order to appeal to a certain segment of the earbud market.  This is perhaps not the ideal response for a hearing instrument.  I'm curious to test other earphones to see which earbuds might have a more flat response.

Caveat:  An important caveat to this work is that the measurements were taken using a 2cc coupler.  Your ear is NOT the same as the 2cc coupler.  In a real ear, the frequency response could be quite different.  Perhaps the overal SPL produced by the earphones will be higher (or lower).  These are important questions.  So, in the future, I'd like to repeat these tests using an artificial ear, which should better simulate a real ear.  Will the results be different than on the 2cc coupler?  I look forward to finding out!

Sunday, May 21, 2017

Calibrating Microphones with Tympan

One goal of our open source hearing aid platform ("Tympan") is to get people to experiment with new sound processing algorithms but another goal of the Tympan is to enable people to experiment with different microphones and speakers.  So, with regards to microphones, we designed the Tympan electronics to have several different kinds of inputs to allow it to support a range of microphones.  Today, I'll start by calibrating three different microphones with the Tympan.  Then, in a later post, I'll look at how the different microphones influence the self-noise of the system.

Microphones:  The three microphones that I'm using today are shown above.  There's the "Sony Mic", which  is a lapel electret mic intended for picking up voice.  Then, there is the "PCB Mic", which is an inexpensive surface-mount silicon MEMS mic that we've included on the Tympan PCB.  And, finally, there's the "Knowles Mic", which is a high-sensitivity, low-noise mic intended for use in hearing instruments like hearing aids.

Why Calibrate?  If you calibrate your microphones, your audio processing will be able to look at the in-coming digital data and know what sound level is happening in the real world.  Knowing the true sound level in the different frequency bands allows you to tailor your algorithms (amplification, compression, noise reduction) to better respond to a person's specific hearing loss.
Calibration Approach:  To calibrate these microphones, I'm using the approach shown above.  Here, I put the Tympan in my sound chamber and play known sounds at it.  I record the digital values obtained by the Tympan (recorded via its SD card) and compare them to the "truth" that was simultaneously recorded from my laboratory-grade microphone (Bruel & Kjaer 4191).

Truth Microphone:  It is important that the truth microphone be placed very close to the Tympan microphone during this calibration.  Ideally, they'll see exactly the same sound levels.  Pictures showing my arrangement is shown below.
Connecting the Tympan Microphone:  Each of the three test microphones connects to the Tympan in a different way:
  • Sony Mic:  Like many lapel microphones, this mic comes nicely packaged with a 1/8" (3.5 mm) phono plug.  We have a mic jack on the Tympan PCB just for this purpose!  I programmed the Typman to supply a 2.5V bias voltage for this microphone.  
  • PCB Mic: This microphone is just a raw element.  We designed the Tympan to have two of these mics right on the circuit board so that they'd be easy to use.  Therefore, this mic is already wired and simply needs to be enabled in the Tympan software.  
  • Knowles Mic: This is a raw hearing aid microphone.  I soldered some wires to it and connected the wires to the Tympan's "line in" holes that are on the edge of the Tympan PCB.  I provided the bias voltage from a pair of AA alkaline batteries.
Software:  For this test, I wrote an Arduino sketch that allows me to switch the Tympan between the three different microphones.  The sketch saves the digitized audio to the Teensy's SD card.  Additionally, the sketch steps through different levels of gain on the Tympan input (0 dB to +40 dB) so that I can see its effect.  My Arduino code is on my GitHub here.  You'll also need the Tympan library, which you can get here.

Example Data:  Below is a spectrogram of the audio data that I recorded during one of these calibration tests.  The top plot shows the audio from the truth microphone.  The bottom plot is the signal recorded by the Tympan, in this case for the Sony mic.  You can see that I had a loop of audio that I was playing over-and-over into the room.  The audio loop alternates between white noise and a 1 kHz test tone.  In the bottom plot, you can clearly the see the effect of increasing the gain of the Tympan input.
Analyzing the Truth Data:  I started by analyzing the truth data.  Looking at just the white noise periods, I filtered the audio into 3rd-octave bands from 125 Hz to 16 kHz and assessed the average signal level in each band.  Because this laboratory microphone is itself regularly calibrated, I know its data in units of Pascals, which leads directly to units of sound pressure level (SPL).  The SPL that I measured in each band is shown in the figure below.  This is the truth to which I will compare the Tympan data.
Analyzing the Tympan Data:  I performed the same 3rd-octave band analysis of the Tympan data.  Because this microphone is not calibrated (that's what we're doing here) I can only measure the signal levels relative to digital full scale (ie, relative to the level at which the system starts to digitally clip the data).  The plot below shows the 3rd-octave band levels that I measured for the Tympan for the five different gain settings.  The blue line at the bottom shows the levels when the input gain was set to 0 dB while the green line at the top is for an input gain of +40 dB.
Combining with the Truth:  The last step to computing the scale factor is to combine the Tympan data with the truth data.  By bringing the two sets of data together, I can compute how the Tympan digital values (dBFS) can be scaled to reveal the true, in-the-air sound pressure level (SPL).  The figure below shows the resulting scale factor for the Sony mic for the different Tympan gain settings.  It is good to see that the gain setting only appears to affect the overall sensitivity of the system -- that the shape of the frequency response is basically the same for all gain settings.

Repeat for Other Mics:  When I perform this calibration process for all of the microphones, I get the figure below.  It shows that the Sony mic (blue) has a up-sloping response, which is good for a closely-placed lapel microphone.  The PCB mic (orange) is more flat, but has nearly the same sensitivity as the Sony mic.  The most interesting response is the Knowles mic (yellow) because it is nearly 20 dB more sensitive than the other two.  That is quite a difference!
What Gain Setting to Use?  In my tests, I tried a bunch of different gain settings.  Which is the right one to use?  Well, one approach to picking the right gain is to decide what is loudest sound that is likely to be seen.  Let's assume that 120 dB SPL is the loudest sound that we want the Tympan to handle  Then, we look at our sensitivity numbers and choose a gain setting that permits this maximum SPL without clipping.  Using the data for the graph above, the calculation goes like this:

  • Sony Mic at 120 dB SPL yields a digital level of: (120-94) + -48.6 = -22.6 dBFS.  This means that it has 22.6 dB of excess headroom.  I can safely set the gain to +20 dB.
  • PCB Mic at 120 dB SPL yields a digital level of: (120-94) + -47.4 = -21.4 dBFS.  This means that it has 21.4 dB of excess headroom.  I can safely set the gain to +20 dB.
  • Knowles Mic at 120 dB SPL yields a digital level of; (120-94) + -28.9 = -2.9 dBFS.  This means that it only has 2.9 dB of headroom.  For this mic, I would leave the gain at 0 dB
We're Calibrated!  With this testing, we've now calibrated these three microphones with the Tympan.  We know the frequency response and we know how to relate our recorded digital values to real-world SPL numbers.  We also have some guidance as to what gain value we should use for each microphone.  We got a lot done!

Follow-Up:  I've added the raw data and my Matlab analysis files to my GitHub repo.  You can get them here.